Indiana Mobility Reports
Abstract
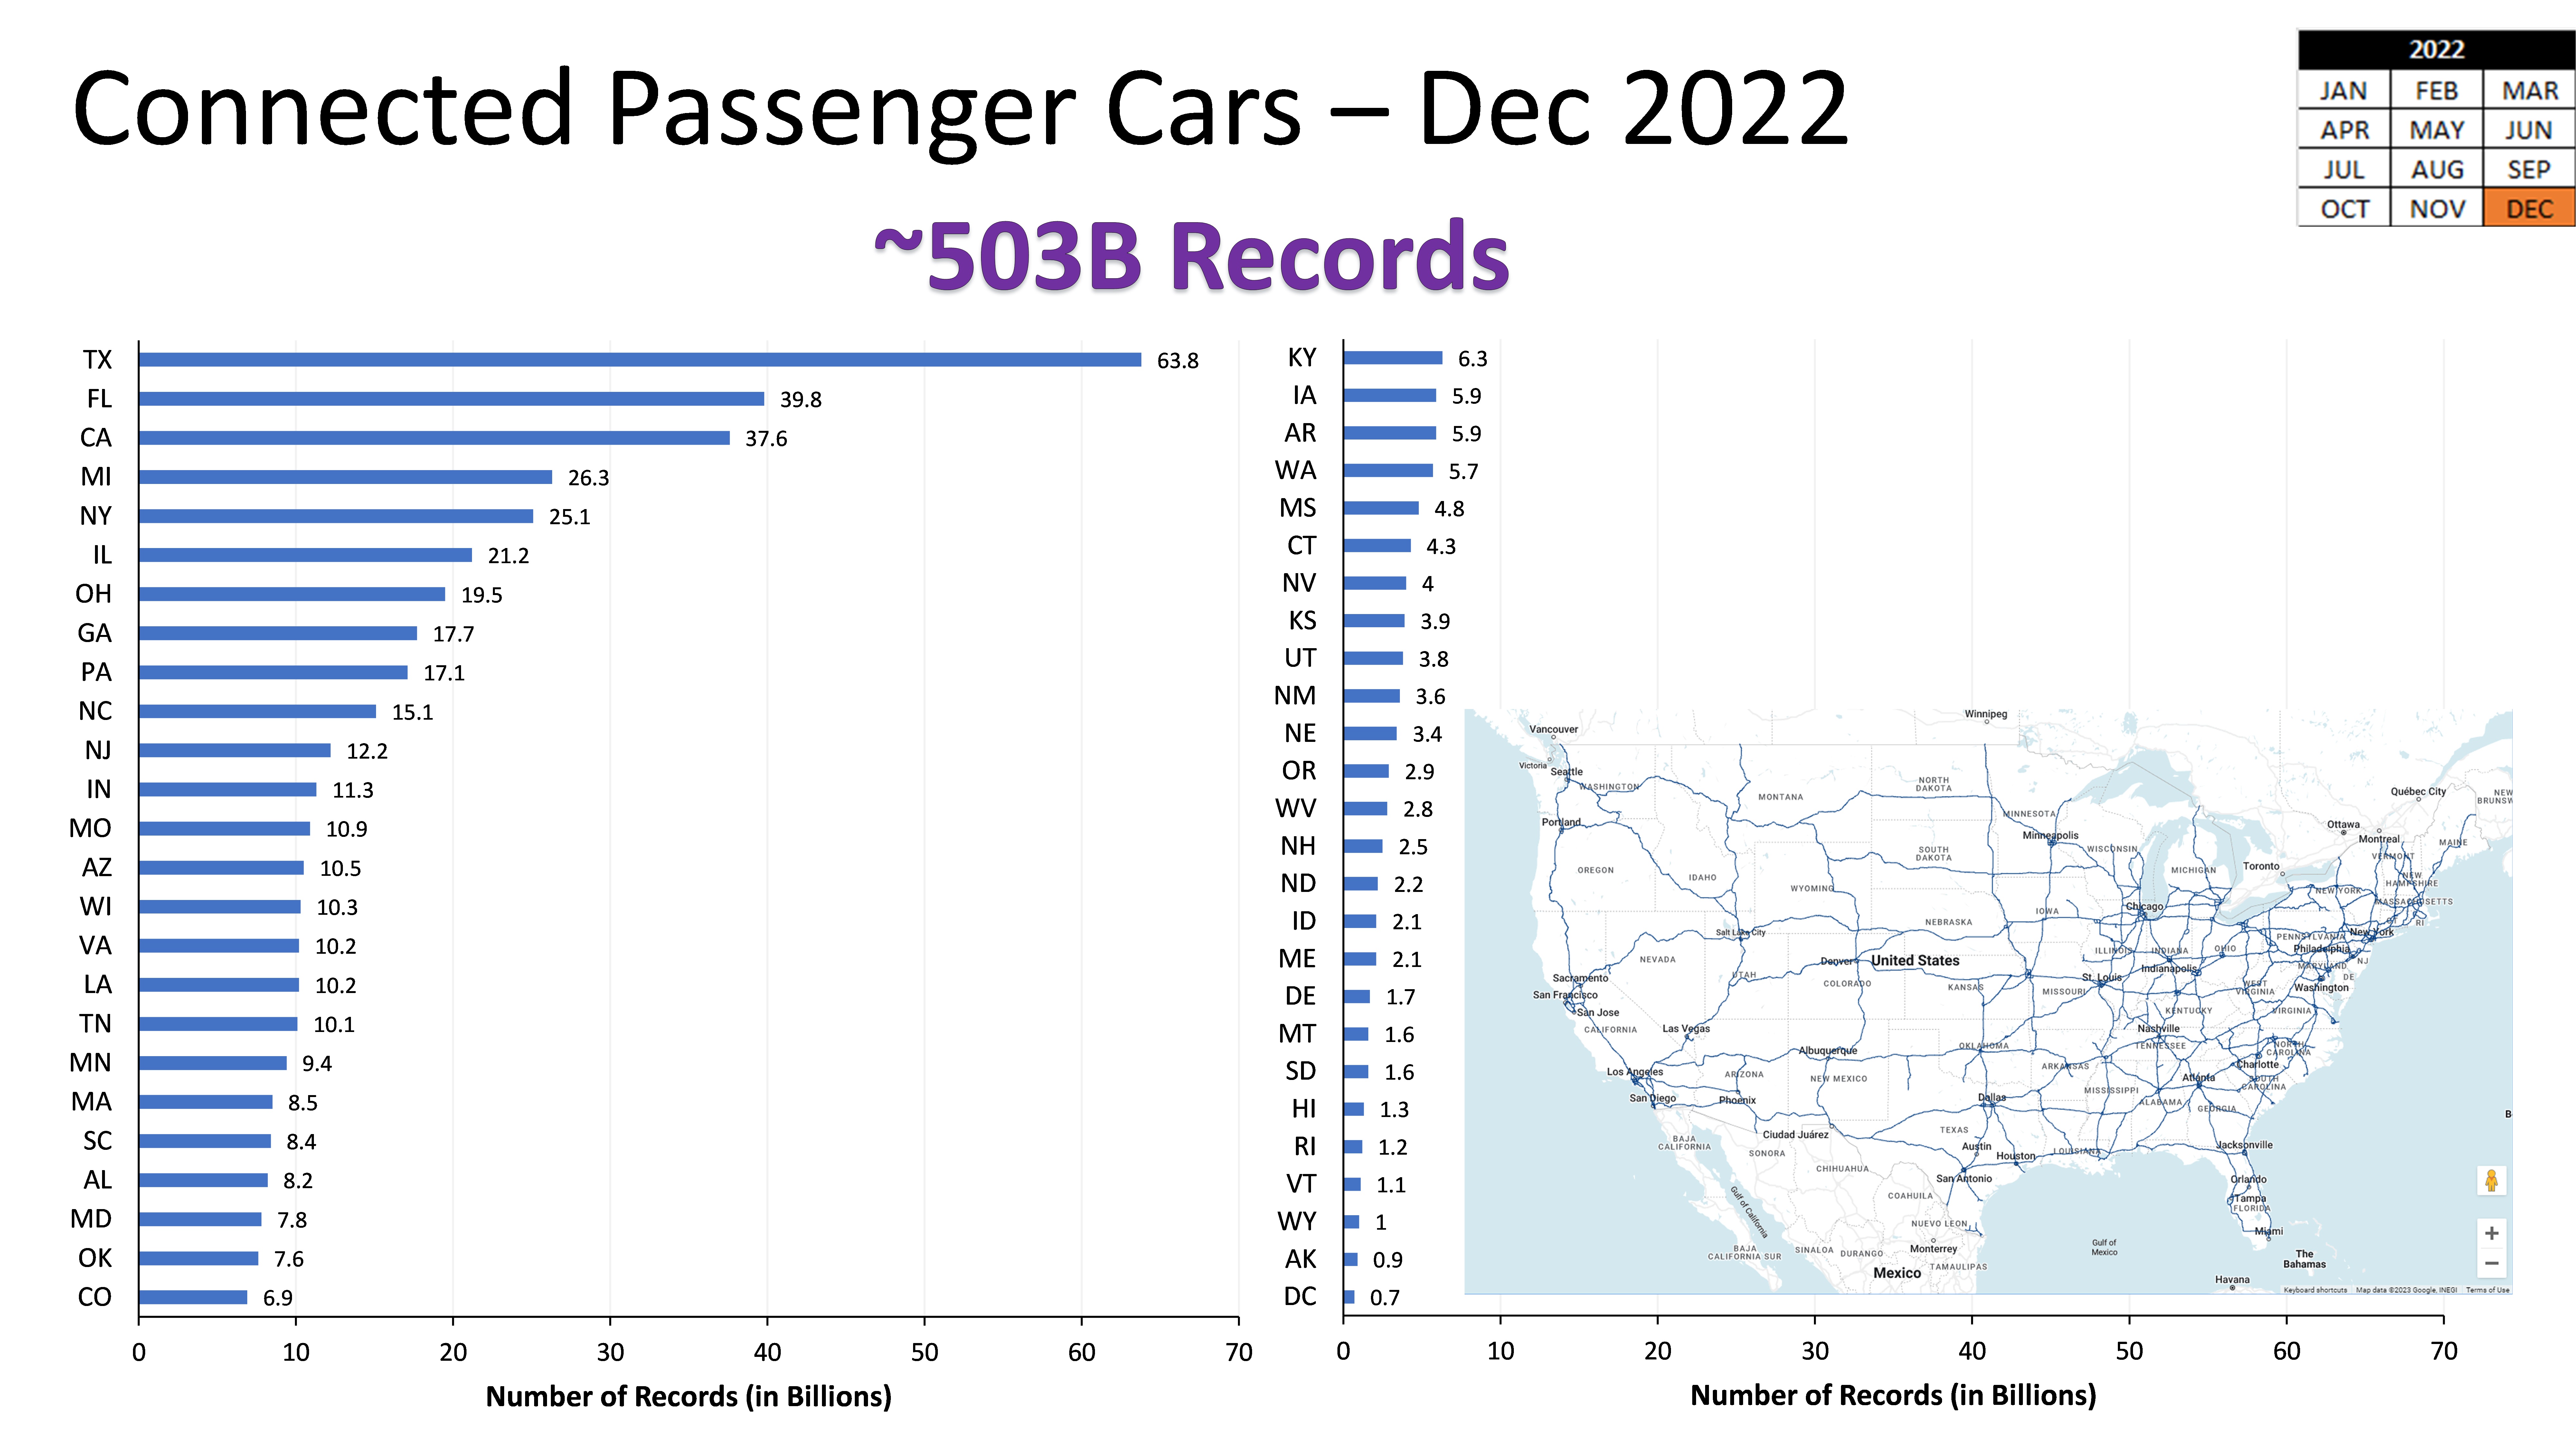
In November 2022, Wejo Data Services Inc. provided Purdue with a national data set comprised of approximately 470 billion connected vehicle records covering all 50 states for the month of August 2022. The goal of the evaluation data set was to create a series of summary graphics to evaluate the scalability of work zone analytics graphics and electric/hybrid vehicle counts at a national level. This report illustrates several performance measures developed using this dataset for all interstate routes, both state wise and cross-country. Statewide graphics are presented for each interstate in the 50 states. There are also a series of multi-state graphics for I-5, I-10, I-15, I-35, I-55, I-65, I-75, I-80, I-90, and I-95. Performance measures include absolute and normalized trip counts classified by type of trip (electric vehicle or hybrid vehicle or internal combustion engine vehicle), weekly heatmaps based on vehicle speed overlaid with hard-braking events and finally, speed profiles by interstate mile markers. The generated performance measures can be found in the supplemental files.
Keywords
connected vehicle, interstate, mobility report, work zones, speed, heatmaps, electric vehicle
Date of this Version
2022
DOI
10.5703/1288284317585
Version
Full Version
Recommended Citation
Desai, J., Mathew, J. K., Li, H., Sakhare, R. S., Horton, D., & Bullock, D. M. (2022). National mobility analysis for all interstate routes in the United States: August 2022. West Lafayette, IN: Purdue University. https://doi.org/10.5703/1288284317585
02_trip_counts_cross_country_routes.pdf (3668 kB)
03_trip_counts_cross_country_routes_100%.pdf (3263 kB)
04_trip_counts_cross_country_routes_30%.pdf (2929 kB)
05_weekly_heatmaps.zip (250311 kB)
06_weekly_heatmaps_hb.zip (261316 kB)
07_speed_profiles.zip (99457 kB)
08_speed_profiles_cross_country_routes.pdf (4845 kB)


Comments
This study is based upon work supported by the ASPIRE award, an Engineering Research Center program by the National Science Foundation (NSF), grant no. EEC-1941524, and the Joint Transportation Research Program administered by the Indiana Department of Transportation and Purdue University.