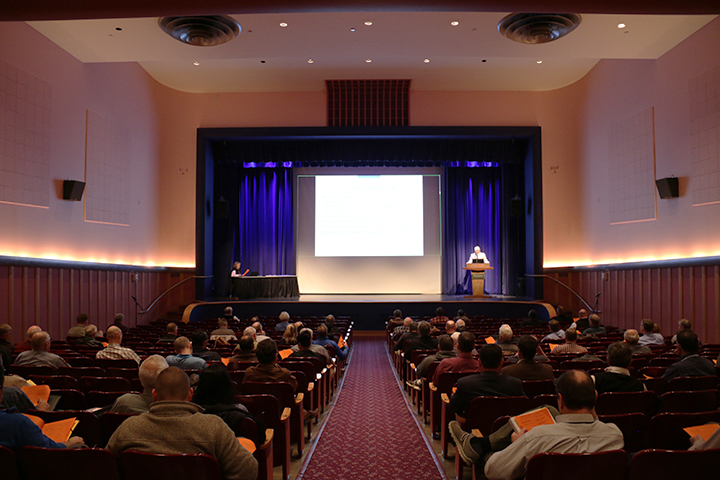
Location
STEW214AB
Session Number
116
Session Title
Integrated Analytics at INDOT Using Tableau
Track Title
Maintenance & Operations
Event Description/Abstract
INDOT has been rapidly expanding its use of Tableau visualization software to glean important insights into our business operations. By utilizing data sources from across the agency via INDOT’s data warehouse and displaying it in intuitive visual representations, the business is able to evolve from a point of “data rich, information poor” spreadsheets to one that allows rapid and iterative analysis. This presentation includes analyses from Fleet, Field Maintenance, and Construction.
Integrated Analytics at INDOT
STEW214AB
INDOT has been rapidly expanding its use of Tableau visualization software to glean important insights into our business operations. By utilizing data sources from across the agency via INDOT’s data warehouse and displaying it in intuitive visual representations, the business is able to evolve from a point of “data rich, information poor” spreadsheets to one that allows rapid and iterative analysis. This presentation includes analyses from Fleet, Field Maintenance, and Construction.


